Week of June 21
Jun 21 – Jun 28, 2026
The last seven days in sealed, read off the price history. What tightened, what took a shock, what moved the most, and which boxes are sitting at the top of their range.
Boxes that pulled away from the pack
Each one climbed while the rest of sealed stayed flat. The move is observed, not the cause. A closing print run is the usual reason, but a fresh allocation or post-launch settling can read the same way.
- Jun 28, 2026
![Crown Zenith Pin Collection [Inteleon]](https://tcgplayer-cdn.tcgplayer.com/product/475618_in_200x200.jpg) TighteningCrown Zenith Pin Collection [Inteleon]
TighteningCrown Zenith Pin Collection [Inteleon]Price +30.1% vs category +7.7% over 90d.
- Jun 28, 2026
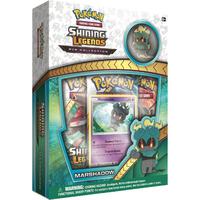
 TighteningShining Fates Elite Trainer Box
Price +28.4% vs category +7.7% over 90d.
- Jun 28, 2026
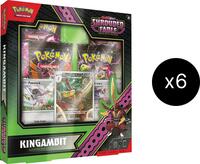
 TighteningKingambit Illustration Collection
Price +29.0% vs category +7.7% over 90d.
- Jun 28, 2026
![Celebrations Premium Playmat Collection [Pikachu V-UNION]](https://tcgplayer-cdn.tcgplayer.com/product/251217_in_200x200.jpg)
Price +27.9% vs category +7.7% over 90d.
- Jun 28, 2026
![Glaceon / Leafeon VSTAR Special Collection [Set of 2]](https://tcgplayer-cdn.tcgplayer.com/product/257375_in_200x200.jpg)
Price +28.0% vs category +7.7% over 90d.
- Jun 27, 2026
 TighteningDestined Rivals Booster Bundle Case
Price +29.6% vs category +9.1% over 90d.
- Jun 27, 2026
 TighteningFusion Strike Elite Trainer Box
Price +29.1% vs category +9.1% over 90d.
- Jun 27, 2026
 TighteningDarkness Ablaze Elite Trainer Box
Price +29.3% vs category +9.1% over 90d.
- Jun 26, 2026
 TighteningKingambit Illustration Collection Case
Price +38.8% vs category +8.2% over 90d.
- Jun 25, 2026
![Crown Zenith Pin Collection [Set of 3]](https://tcgplayer-cdn.tcgplayer.com/product/475620_in_200x200.jpg) TighteningCrown Zenith Pin Collection [Set of 3]
TighteningCrown Zenith Pin Collection [Set of 3]Price +29.9% vs category +8.3% over 90d.
- Jun 25, 2026
![Ultra Prism Theme Deck - "Mach Strike" [Garchomp]](https://tcgplayer-cdn.tcgplayer.com/product/155665_in_200x200.jpg)
Price +35.6% vs category +8.3% over 90d.
- Jun 25, 2026
Price +28.5% vs category +8.3% over 90d.
- Jun 25, 2026
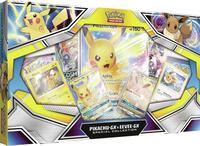 TighteningPikachu GX & Eevee GX Special Collection
Price +31.5% vs category +8.2% over 90d.
- Jun 25, 2026
![Champion's Path Pin Collection [Hulbury Gym]](https://tcgplayer-cdn.tcgplayer.com/product/218794_in_200x200.jpg)
Price +30.7% vs category +8.2% over 90d.
- Jun 24, 2026
![Shining Legends Super-Premium Collection [Ho-Oh GX]](https://tcgplayer-cdn.tcgplayer.com/product/148412_in_200x200.jpg)
Price +29.7% vs category +9.4% over 90d.
- Jun 23, 2026
![XY Evolutions Single Pack Blister [Greninja]](https://tcgplayer-cdn.tcgplayer.com/product/603422_in_200x200.jpg)
Price +64.8% vs category +8.5% over 90d.
- Jun 23, 2026
![Paldea Evolved 3 Pack Blister [Set of 2]](https://tcgplayer-cdn.tcgplayer.com/product/496908_in_200x200.jpg) TighteningPaldea Evolved 3 Pack Blister [Set of 2]
TighteningPaldea Evolved 3 Pack Blister [Set of 2]Price +28.8% vs category +8.5% over 90d.
- Jun 23, 2026
![Chilling Reign Elite Trainer Box [Shadow Rider Calyrex]](https://tcgplayer-cdn.tcgplayer.com/product/236261_in_200x200.jpg)
Price +28.9% vs category +8.5% over 90d.
- Jun 23, 2026
![Evolving Skies Premium Checklane Blister [Houndoom]](https://tcgplayer-cdn.tcgplayer.com/product/247603_in_200x200.jpg)
Price +32.9% vs category +8.5% over 90d.
- Jun 23, 2026
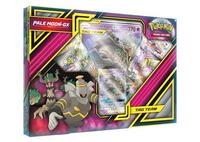 TighteningPale Moon GX Box
Price +58.7% vs category +8.5% over 90d.
- Jun 22, 2026
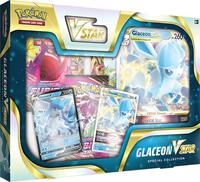 TighteningGlaceon VSTAR Special Collection
Price +31.5% vs category +8.4% over 90d.
- Jun 22, 2026
![Obsidian Flames Single Blister Pack [Houndstone]](https://tcgplayer-cdn.tcgplayer.com/product/557086_in_200x200.jpg)
Price +29.4% vs category +8.3% over 90d.
- Jun 22, 2026
![Obsidian Flames Single Blister Pack [Annihilape]](https://tcgplayer-cdn.tcgplayer.com/product/557084_in_200x200.jpg)
Price +84.4% vs category +8.3% over 90d.
- Jun 22, 2026
![Paldean Fates Premium Collection [Set of 3]](https://tcgplayer-cdn.tcgplayer.com/product/528324_in_200x200.jpg)
Price +33.6% vs category +8.4% over 90d.
- Jun 22, 2026
Price +36.0% vs category +8.3% over 90d.
- Jun 22, 2026
![Chilling Reign Premium Checklane Blister [Blaziken]](https://tcgplayer-cdn.tcgplayer.com/product/236276_in_200x200.jpg)
Price +31.4% vs category +8.2% over 90d.
- Jun 21, 2026
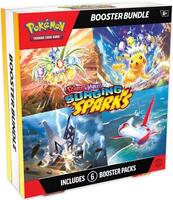 TighteningSurging Sparks Booster Bundle (Retail)
Price +49.3% vs category +9.5% over 90d.
- Jun 21, 2026
Price +32.9% vs category +9.5% over 90d.
- Jun 21, 2026
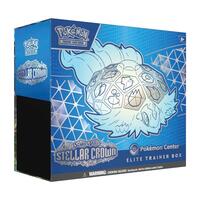
 TighteningStellar Crown Booster Bundle
Price +40.6% vs category +9.5% over 90d.
Sharp drops against the market
Products that fell hard against the rest of sealed this week. A reprint, a new wave of stock, or heavy selling could each be behind a move like this.
- Jun 26, 2026
 Supply shockPerfect Order Booster Bundle
Price -8.6% vs category +2.5% over 30d.
- Jun 25, 2026
 Supply shockPerfect Order Elite Trainer Box
Price -9.0% vs category +2.4% over 30d.
- Jun 24, 2026
![Surging Sparks Premium Checklane Blister [Alakazam]](https://tcgplayer-cdn.tcgplayer.com/product/565638_in_200x200.jpg)
Price -7.7% vs category +2.3% over 30d.
- Jun 24, 2026
The widest swings of the week
The largest seven-day price changes across the investable catalog, both directions. Boxes, cases, ETBs, and bundles only.
Up the most
Gainers
| Product | Price | 7d | |
|---|---|---|---|
| 01 | $213 | +18.9% | |
| 02 | $2,356 | +18.1% | |
| 03 | $214 | +17.9% | |
| 04 |
Trading at the top of the range
Investable boxes sitting at or within a hair of their highest tracked price after a positive week. A read on where they are now, not a call on where they go next.
 Prismatic Evolutions Elite Trainer BoxPrismatic Evolutions$213+18.9%
 $2,356+18.1%
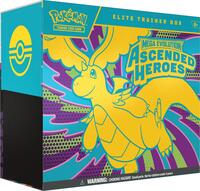 Ascended Heroes Elite Trainer BoxAscended Heroes$214+17.9%
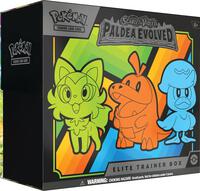
A recap of observed data over the last seven days, not financial advice. Every figure is the price history reading back, not a forecast.